Know where your AI budget is going
See how people use each supported feature, what each task costs, and how spending changes over time. The views you get depend on your plan and the activity Charigent has recorded.
What you get
Recorded usage and cost visibility
Review available usage, cost, and trend data while keeping event freshness and your own business outcomes in context.
Up-to-date usage details
Dashboards show recorded AI requests and actions. New information appears after the activity has been recorded.
Spending Breakdown
Review recorded costs for each supported feature and kind of task.
Time-series Charts
Daily, weekly, and monthly trend views with anomaly highlighting to surface unusual spend sooner.
Cost for each kind of task
Compare the recorded cost of each supported task. To judge its business value, compare that cost with your own results.
Export & Reporting
Download usage and billing data as CSV for accounting, audits, or integrating with your own BI tools.
Use cases
Built for teams that care about costs
Budget Management
Set spending targets, monitor recorded usage, and configure available alerts. Timing and delivery can vary.
ROI Analysis
Compare AI spend with available output counts, then combine it with your own business outcome data to evaluate ROI.
Capacity Planning
Use historical trends as planning input; they do not guarantee future usage or prevent overages.
See it in action
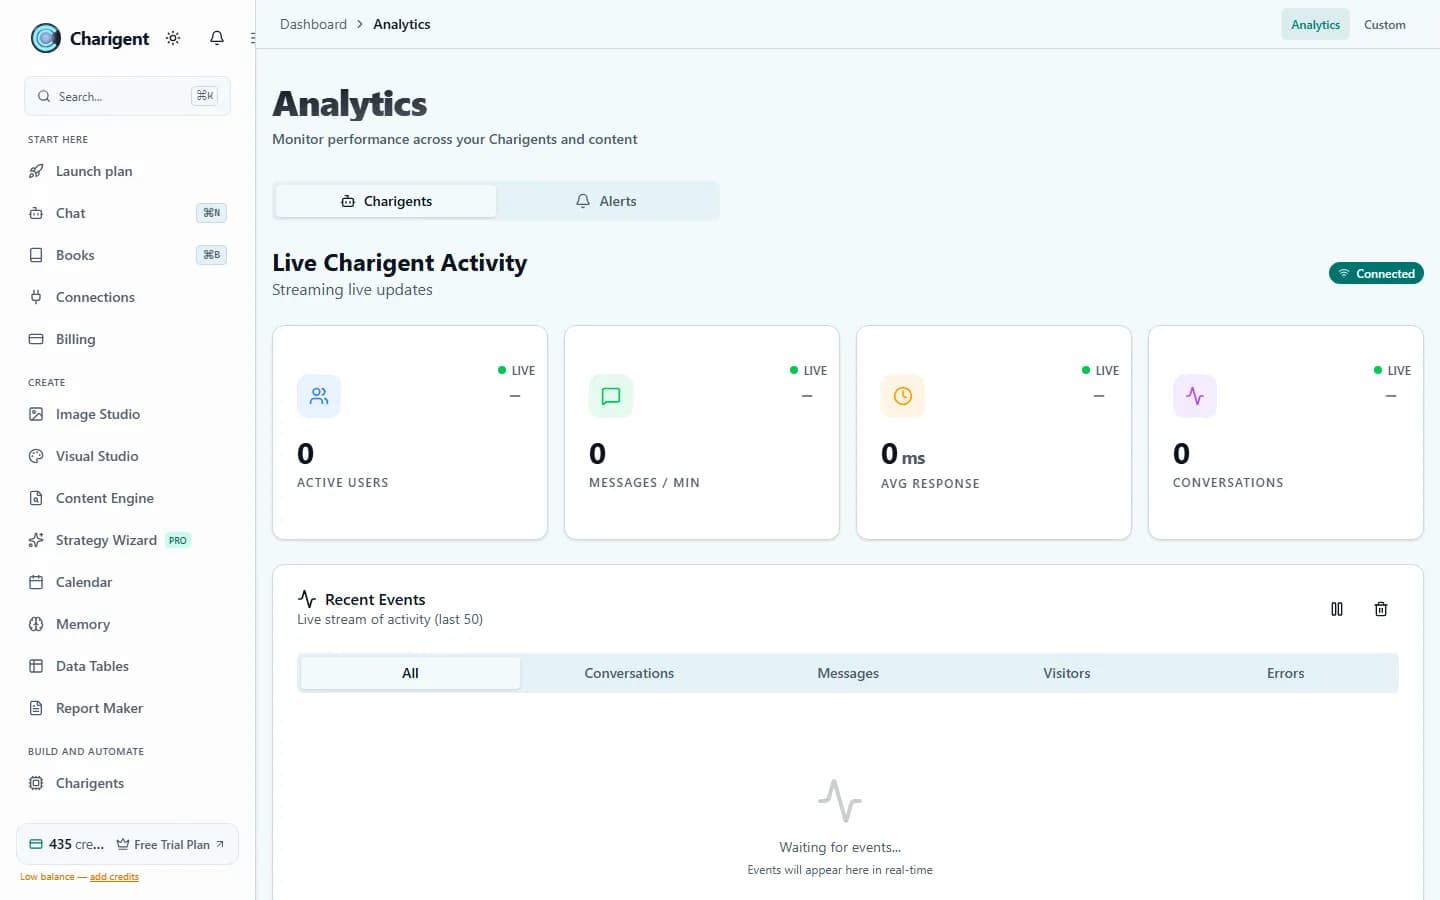
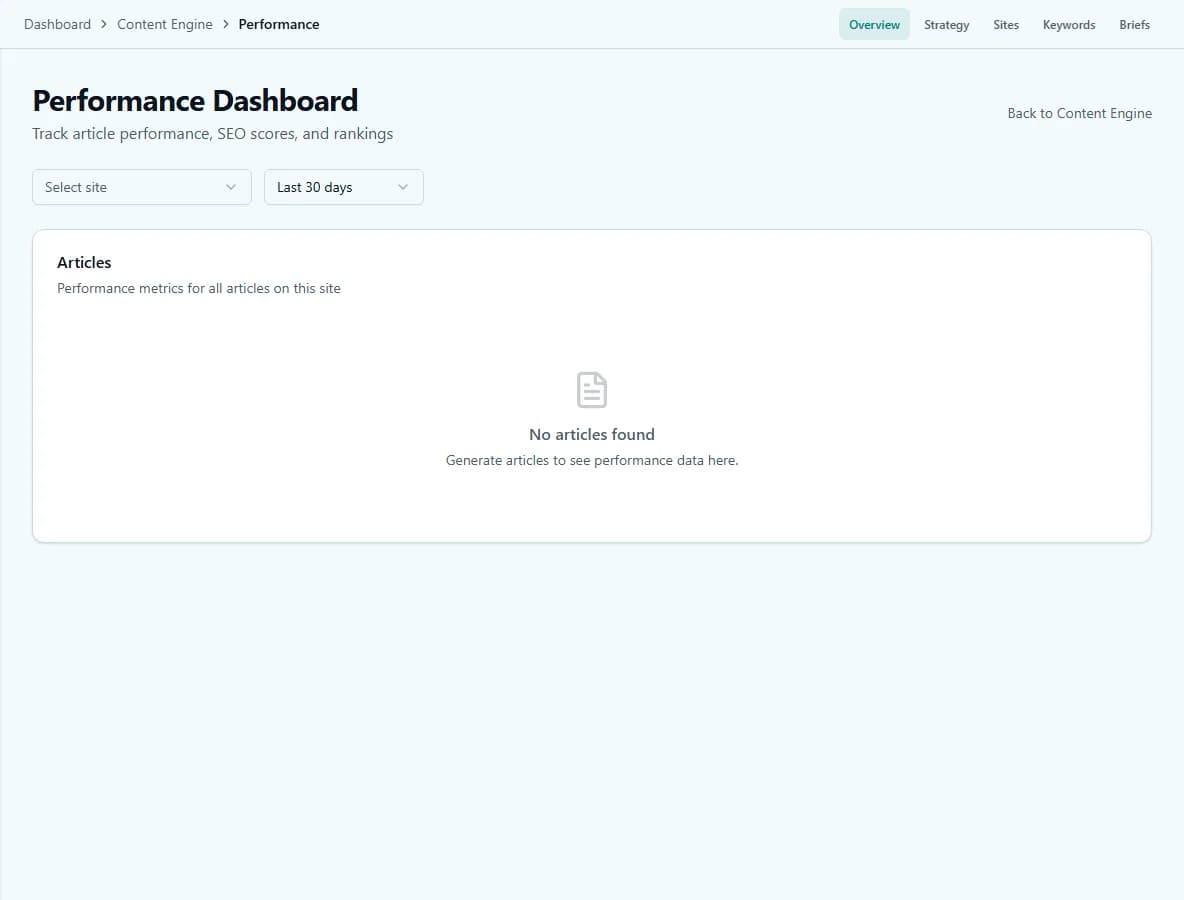
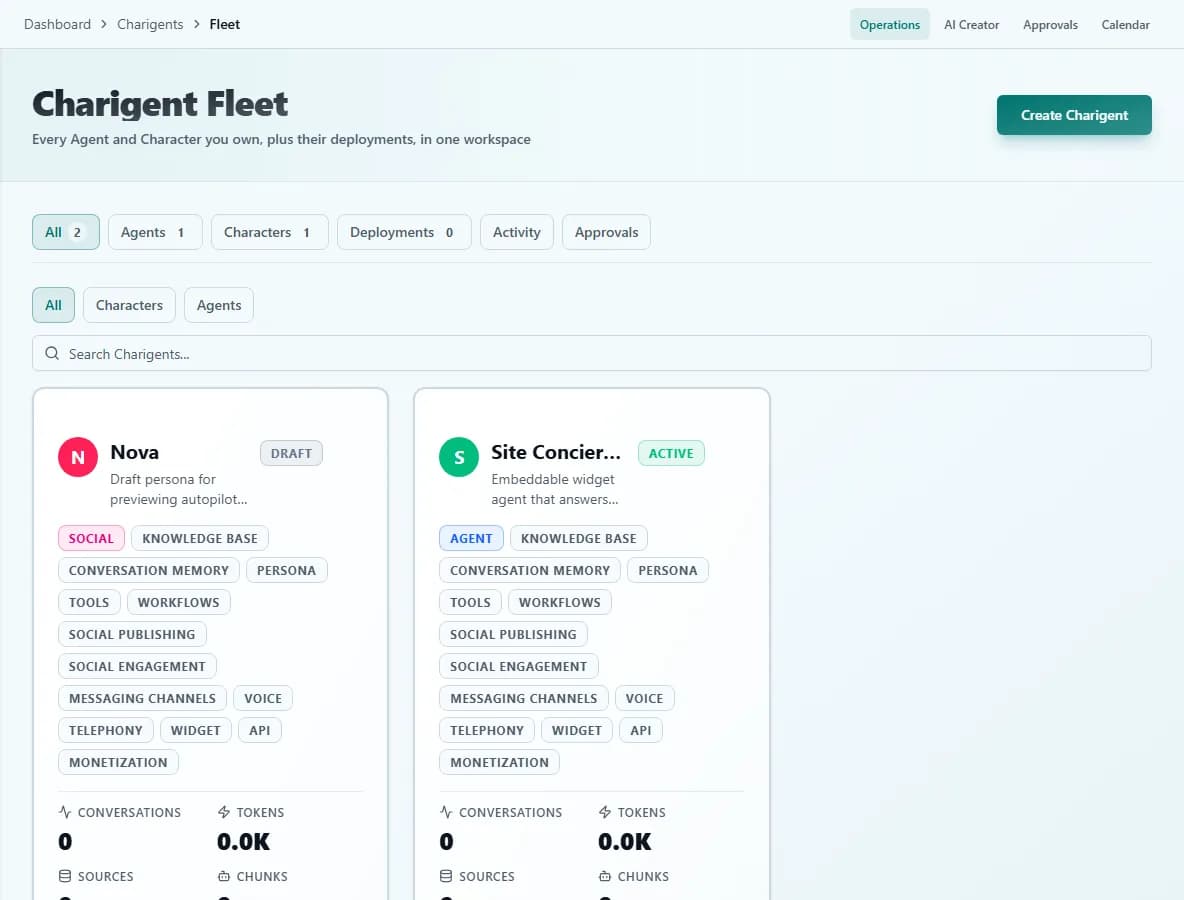
Current Charigent product views
FAQ
Frequently asked questions
Which plan do I need for the full analytics dashboard?
What does the dashboard actually show?
Can I export the data?
Does it update in real time?
Can it predict my future usage or prevent overages?
Understand recorded AI usage and costs
Start your 14-day free trial. Card required to start; converts automatically to a paid plan when it ends, unless you cancel first.
Get Started Free